Introduction
More GPUs should reduce AI model training time. Anyone who has run a distributed job knows it does not always work that way. Gartner expects worldwide spending on AI infrastructure to reach nearly $1.4 trillion in 2026, yet a Cast AI analysis of tens of thousands of Kubernetes clusters found average GPU utilization of just 5%. A lot of expensive silicon is simply waiting.
The cause can be due to underused GPUs, congested networks, heavy communication overhead, memory limits, or a failing card. Even a single underperforming node in a large-scale GPU cluster can affect the entire training workload. This makes systematic GPU cluster troubleshooting essential. Instead of changing configurations randomly, engineers need to identify where performance is being lost.
Why AI Model Training Stalls?
Slow distributed AI training usually comes from one or more infrastructure or software issues. In practice, five areas cause most of the trouble:
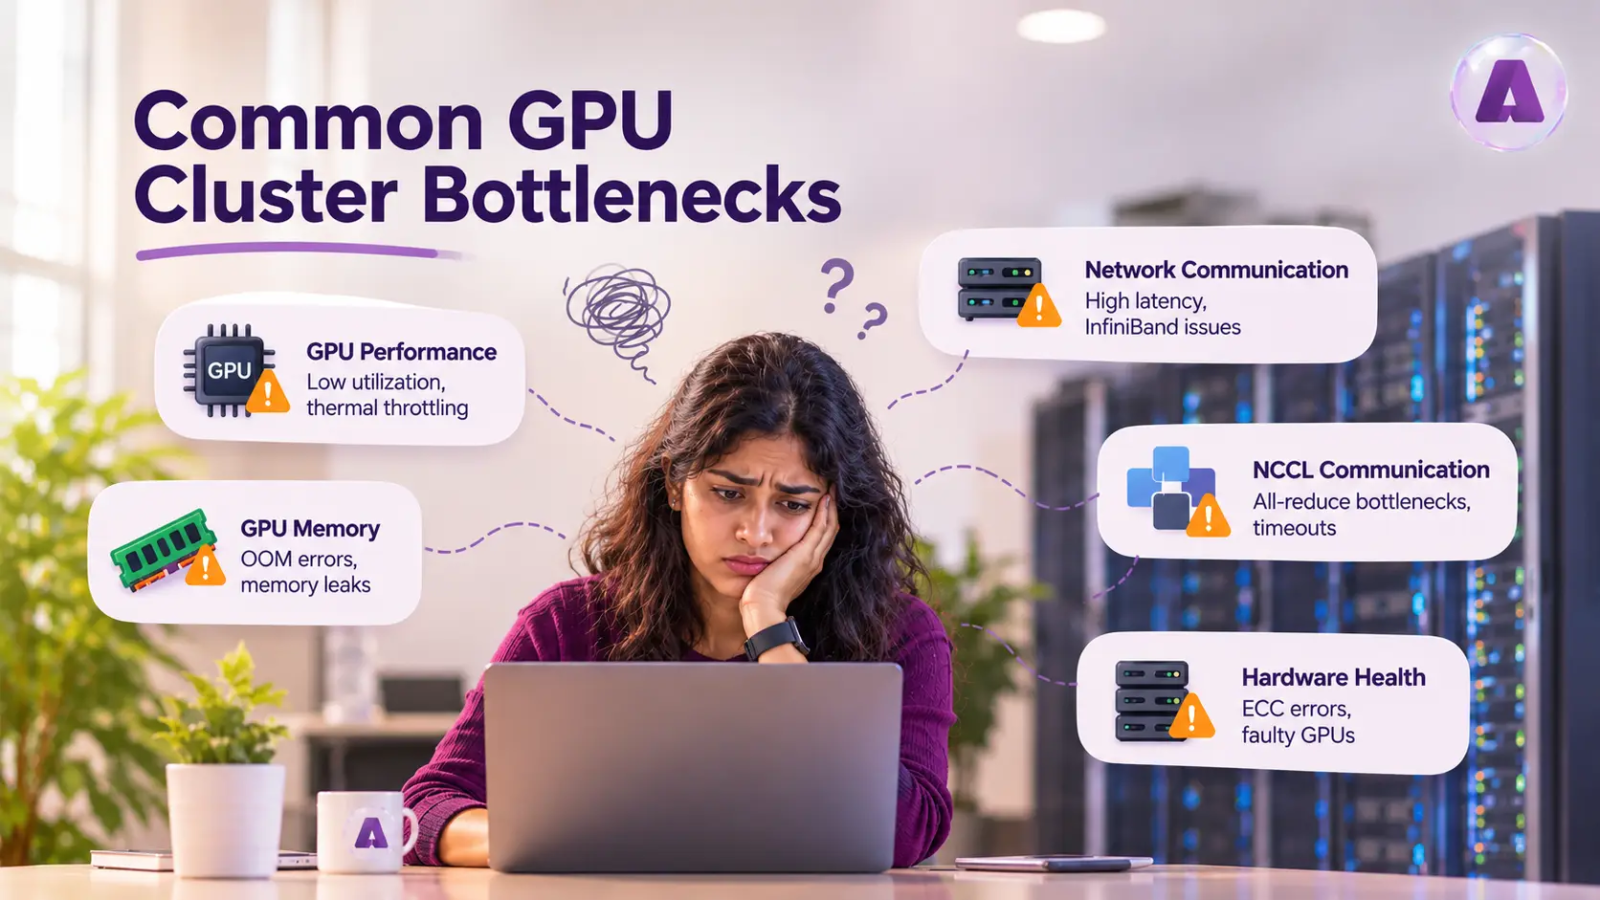
- GPU performance: Low GPU utilization, thermal throttling, and inconsistent clock speeds prevent GPUs from delivering expected performance.
- Network communication: InfiniBand congestion, RDMA failures, and high network latency delay communication between GPU nodes.
- NCCL communication: All-reduce bottlenecks, NCCL timeouts, and communication hangs slow synchronization during distributed training.
- GPU memory: CUDA out-of-memory errors, memory leaks, and limited VRAM can interrupt training or reduce batch sizes.
- Hardware health: ECC errors, NVIDIA Xid events, PCIe failures, and faulty GPUs can cause instability or inconsistent performance.
The challenge is that these issues produce similar symptoms. For example, low GPU utilization may indicate a network bottleneck rather than a GPU performance problem.
A Step-by-Step Diagnostic Approach on How to Troubleshoot a GPU Cluster
Work from the bottom up. Each step rules out one layer before you move to the next, and change only one thing at a time, so you know what helped.
Step 1: Check GPU utilization and hardware health
1. Start by checking whether every GPU is performing as expected.
Use the following diagnostic command to watch GPU utilization, memory consumption, temperature, power usage, and clock speeds.
nvidia-smi
2. Compare these metrics across all GPUs and nodes. If one GPU consistently reports lower utilization or clock speeds, investigate possible thermal throttling, power limitations, or hardware issues.
3. Use NVIDIA Data Center GPU Manager (DCGM) to monitor GPU health. Its health checks can identify ECC memory errors, Xid events, PCIe problems, thermal violations, and NVLink issues.
4. Compare nodes side by side and look for stragglers. In a synchronous distributed training optimization job, one GPU running slower than its peers drags everyone down with it.
Step 2: Identify GPU communication bottlenecks
1. Inside a node, confirm NVLink and PCIe links are healthy and running at full width.
2. Check whether the GPU-to-GPU and GPU-to-NIC connections match the expected hardware topology. Useful diagnostic commands include:
ibstat
perfquery
These help inspect InfiniBand device status and port-level performance counters.
3. Benchmark to collective communication operations, including all-reduce using the command:
nccl-tests
4. Compare measured bandwidth and latency against the expected baseline.
5. If network bandwidth is lower than expected, investigate link errors, congestion, RDMA configuration, and network interface selection.
Step 3: Investigate NCCL errors and communication delays
1. Turn on NVIDIA Collective Communications Library (NCCL) logging:
NCCL_DEBUG=INFO
2. Check NCCL logs for:
- Incorrect network interface selection
- GPU nodes connection failures
- Slow all-reduce operations
- NCCL timeouts and communication hangs
- Inconsistent communication performance across ranks
3. Reproduce them with collective performance tests to isolate whether the trouble sits in one node, one link, or the whole fabric.
4. To validate GPU-to-GPU communication paths and network performance, enable active diagnostics using:
NCCL_RUN_DIAGNOSTICS=1
5. Run the application with this setting to identify communication path failures during communicator initialization.
Step 4: Profile distributed training performance
1. If GPU hardware and networking appear healthy, investigate the training workload itself.
2. To spot GPU idle time, CPU bottlenecks, and communication gaps, use NVIDIA Nsight Systems .
3. To examine operator execution, data loading, and synchronization overhead, use PyTorch Profiler.
4. Compare training throughput and scaling efficiency across different GPU counts.
For example, if increasing the cluster from 8 to 16 GPUs produces very little improvement, investigate communication overhead, data pipeline limitations, and synchronization delays.
How to Prevent Recurring Performance Issues During GPU Cluster Optimization
Fixing a slowdown once is good. Never meeting it again is better. A few steady habits go a long way:
- Keep GPU drivers, CUDA, NCCL, and firmware versions consistent across every node.
- Tune data loading and communication patterns so GPUs are not left waiting.
- Monitor GPU temperatures, power limits, and memory usage.
- Validate InfiniBand/RoCE performance and GPU-to-NIC topology after any change.
- Run continuous GPU health monitoring with scheduled preventive maintenance.
GPU cluster optimization should also include regular hardware validation and configuration checks. Identifying small performance variations early can prevent them from becoming larger training disruptions.
Keeping GPU Clusters Performance-Ready with Aptly Tech
GPU cluster downtime can be expensive. More than half of unexpected job interruptions in large-scale AI clusters are linked to GPU hardware failures, including issues with onboard HBM3 memory. For AI workloads, even a minor infrastructure issue can disrupt distributed training, delay model development, and leave expensive GPUs underutilized. Preventing these disruptions requires proactive monitoring, timely troubleshooting, and reliable infrastructure support.
In such cases, Aptly Tech, an AI datacenter buildout and support partner, helps maintain GPU cluster deployment and performance through end-to-end infrastructure services. This includes:
- GPU hardware validation: Identifying hardware faults and verifying cluster readiness before workloads begin.
- Infrastructure monitoring: Tracking GPU utilization, network performance, power availability, and cooling conditions.
- Performance troubleshooting: Diagnosing hardware, networking, and infrastructure issues that affect distributed AI training.
- 24×7 infrastructure operations: Monitoring cluster health and resolving operational issues to minimize downtime.
With proactive infrastructure management and experienced support teams, Aptly Tech helps enterprises identify potential issues early, reduce disruptions, and keep GPU clusters ready for demanding AI workloads.
Conclusion
Slow distributed AI training does not always indicate insufficient GPU capacity. The problem may originate from hardware failures, network bottlenecks, NCCL communication, or software configuration. Systematic GPU cluster troubleshooting helps engineers identify the actual bottleneck, restore performance, and make informed infrastructure decisions before investing in additional GPU capacity.
Aptly Tech support enterprises keep GPU clusters performance-ready through hardware validation, infrastructure monitoring, deployment, commissioning, and 24×7 operational support. Our team helps identify infrastructure issues, minimize downtime, and maintain reliable performance across AI workloads.
Looking to improve your GPU cluster performance? Connect with Aptly Tech to explore how our AI infrastructure expertise runs distributed AI workloads more efficiently in your enterprise.
FAQs
Q1. How do you troubleshoot a GPU cluster?
Work layer by layer. Check GPU utilization and hardware health with nvidia-smi and DCGM, validate NVLink, PCIe and InfiniBand performance, review NCCL logs, then profile training with Nsight Systems and PyTorch Profiler. Compare each result against your hardware baseline.
Q2. Why are GPUs underutilized during distributed training?
GPUs sit idle because something upstream is slow. Data loading, storage or network bandwidth, CPU preprocessing, or synchronization waits between nodes. Profiling shows which stage the GPUs are waiting on.
Q3. What causes slow multi-GPU training?
Common causes include network congestion, communication overhead from all-reduce operations, a straggler GPU, thermal throttling, memory pressure, and inconsistent driver or NCCL versions across nodes.
Q4. How can you identify an NCCL communication bottleneck?
Run nccl-tests and compare bandwidth and latency with your expected baseline. Then enable NCCL_DEBUG=INFO and check which interfaces NCCL selected and whether any connections failed or retried.
Q5. How do you fix NCCL timeout errors?
Find the cause before raising the timeout. Look for a hung or failed rank, a faulty link or NIC, a wrong network interface selection, mismatched software versions, or GPU errors such as Xid events. Once the root cause is fixed, adjust timeouts only if needed.
Q6. How does Aptly Tech help maintain GPU cluster performance?
Aptly Tech supports GPU cluster readiness, deployment, commissioning, and ongoing infrastructure operations. Its services include GPU hardware validation, network connectivity checks, and monitoring of GPU, power, and cooling infrastructure. Through 24×7 operational support and infrastructure troubleshooting, Aptly Tech helps enterprises identify potential issues, minimize downtime, and maintain GPU cluster availability.